Skip to content

Archive

Category: Fractals

A few days ago I blogged about my first Android app, and in that post I promised another one coming along soon. Well, it is now done.

For my second foray into Android application development, I decided to port some C# code I had previously written to draw a plasma fractal to Java.

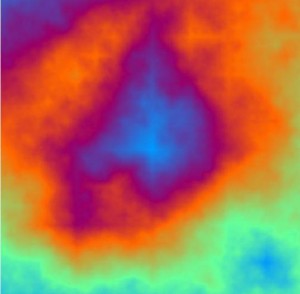
A plasma fractal

A plasma fractal

The original code is based on a Java applet written by Justin Seyster, which I ported to C#, and modified slightly, a few years ago for another project.

I have previously blogged about the algorithm used to generate the plasma fractal itself in my series on Fractals in C#, so I won’t go into detail about how the fractal is generated here.

The application consists of three activies.

The main activity displays the generated plasma fractal, with menu options to refresh the fractal, which regenerates the fractal, and saving the image to the sdcard.

The menu also has options to launch the settings activity and the about activity.

The settings activity enables you to change the fractal type – the options being, Plasma, Cloud and Grayscale – as well as the roughness, which changes the amount of variation in the image.

The about activity merely showssome information about the application.

While, by no means, a complicated application, this app implements a fair amount of Androids basic features.

You can download the Plasmatic android package here

Share

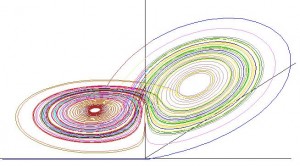
The Lorenz attractor is a fractal based on the Lorenz oscillator, which is a 3-dimensional chaotic system.

Lorentz Attractor

Lorentz Attractor


For a full explanation on the Lorentz attractor, you can read the wikipedia article here.

The central equations needed for the Lorenz oscillator are:
dx/dt = σ(y – x)
dy/dt = x(ρ – z) – y
dz/dt = xy – βz

σ is the Prandtl number, and is usually set to 10.
ρ is the Rayleigh number and can be varied.
β is set to 8/3.

Now, drawing the Lorenz attractor in C#, we are going to iterate a fixed number of times through these equations. In the code below, ρ is set to 28, and the number of iterations to 8000.

The code is able to draw the attractor in two dimensions or three dimensions, and the first part of the code calculates the transformations we will use later to transform the coordinates of attractor (which are in three dimensions) to screen coordinates.

We then iterate through each iteration, taking the x, y and z from the previous iteration, and running them through the Lorens oscillator equations to get our first set of derivatives.

We then add these to the previous x,y and z values, and then run them through the equations again, getting our second set of derivatives, and then add these to the x,y and z values as before. We repeat this until we get four sets of derivatives.

Once we have that we then add them together multiply by a scaling factor, and and them to x, y and z respectively.

Now that we have the new coordinates, we can plot a point at that position, applying our transformations to convert the three dimensional coordinates to screen coordinates.

You can get the full source code here.
continue reading…

Share

For anyone who has studied calculus, the Newton-Rhapson method should be familiar. To those who have not, I do apologize if I lose you, but will try to make it easy.

The Newton-Rhapson method is a way to find the roots of a function using approximations.

So, for the non-maths people out there, a function is denoted by f(x) and can be any equation, for example f(x) = x^2 + 3, or f(x) = sin(x). Now, the roots of a function are defined by f(x) = 0, so it is wherever the function equals zero.

Another important concept here is the derivative f’(x). This is the rate of change of the function f(x), but by going any deeper, I know I will lose the non-maths guys, and I am sure any of you who know some maths already know about derivatives.

The Newton-Rhapson method tries to find the values of the root by approximating the root, and then iterating using the procedure a’ = a – f(a)/f’(a) where a is the approximated root, and a’ is the closer approximation. The procedure is then repeated replacing a with the new a’ value, as many times as is needed to achieve the required accuracy.

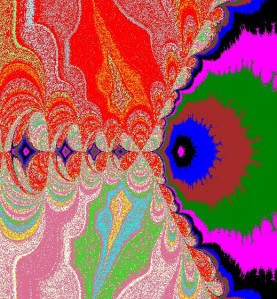
Newton Rhapson

Newton Rhapson


So how the function that generates the fractal works, first we take our canvas, and iterating through each pixel in the canvas, we get x and y values, which are made up of the minimum values – which are passed as a parameter, so that we can view any part of the Cartesian space – and then add to that the column (or row) we are on multiplied by the scaling factor.

Now that we have our values we are going to pass into our function, and have set up a few values before we iterate, we start the iteration.

We keep on iterating, using the Newton-Rhapson method to find new values for x and y, and finally finished iteration when either we have reached a point where the values are as accurate as they are ever going to be, or else we have reached the amount of iterations we are going to allow.

Now that we have done that, we can select the color to draw at that particular point. We have created an array of 16 colours, and then depending on values of x and y, we use certain colours, based on the iteration in which we reached our value.

If x is larger than 0, then the first 5 colours are used. If y > 0 and x is less than -0.3 then the next 5 colours are used, and for everything else the last 6 colours are used.
continue reading…

Share

Julia sets are very similar to Mandelbrot sets, and if you have not yet looked at my post on generating Mandelbrot sets, then I suggest you take a look. Most of the background is the same.

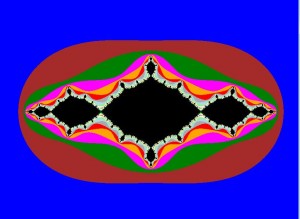
Julia Set

Julia Set

The only major difference is between Julia sets and the Mandelbrot set is that the Mandelbrot iteration is based on the equation Z = Z^(Power 1) + Z^(Power 2) + C, where C is the pointZ(0). The Julia set is based on the equation Z^(Power 1) – Z^(Power 2) – L, where L is a constant complex number.

We iterate through each point, using the centre of the screen as the origin (0,0). For each point then, we iterate up to our maximum depth, using the Julia formula now instead of the Mandelbrot one, and break when the absolute value of Z reaches 2.

We can then draw the point, using the same method as we used for drawing the Mandelbrot point.

You can get the full source code here.

		public void Generate(Graphics g, int iIterations, double Scaling, int iInitialSize, Complex L, double iOffsetRe, double iOffsetIm, int iLeft, int iTop, int iWidth, int iHeight, int iPower, int iPower2)
		{
			Complex Z = new Complex( 0.0, -0.0);
			Complex Offset = new Complex( 0.0, -0.0);

			// iterate over the area in the complex plane indicated by the Scaling and Offset
			//   i is the real axis,  j is the complex axis

			for (double i = -iWidth/2; i < iWidth/2 ; i++)
			{
				for (double j = -iHeight/2; j < iHeight/2; j++)
				{
					// Normalize Z and adjust for Scaling and Offset
					Z.re = (i/((double)iInitialSize)) * Scaling + (double)iOffsetRe;
					Z.im = (j/((double)iInitialSize)) * Scaling + (double)iOffsetIm;

					// C is the Z(0) of the formula based on the pixel position
					// We've also added a ManualOffset from the text boxes on the screen

					int iteration = 0;

					for (int k = 1; k < iIterations; k++)
					{
						Z = (Z^iPower) - (Z^iPower2) - L;
						// if modulus of Z > 2, break out of the loop
						// and remember the current iteration to choose the color
						if (Z.Abs() > 2.0)
						{
							iteration = k;
							break;
						}
					}

					DrawComplexPoint(g, ((int)i) + (iWidth/2), ((int)j) + (iHeight/2), iteration);
				}
			}
		}
Share

Of all the fractals around, the Mandelbrot set is one of the most famous, largely because it creates quite a complex and beautiful image. In my view anyway.
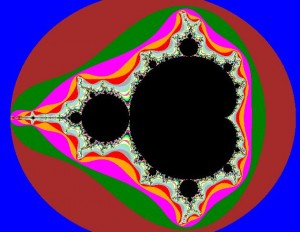
Mandelbrot

Mandelbrot


The actual method of calculating a Mandelbrot is relatively easy to follow. easy, that is, if you know what complex numbers are. A complex number is an imaginary number that is based on the squareroot of -1, which does not exist as a real number, and is usually denoted by i. A complex number is made up of a real part and an imaginary part, in the form Z = xi + y, where x and y are both real numbers, except that x is multiplied by the imaginary i.

Right, so enough maths before I lose you all completely.

So for our function that generates the Mandelbrot, we pass it various parameters which control the scaling, size and offset, which can be used to zoom in on particular areas. This is unimportant in the actual calculation of the fractal, except as modifiers for the calculations so that they calculate the correct area. The important parameters are the iterations, and the powers, as they will directly influence the calculations.

The Complex class which is used in the code to define the complex numbers in a complex number class which I have written, which I wont go into detail here, but iti s included with the source code. I will cover the inner working of that class in another post in the future.

So, on to how to calculate the Mandelbrot. we first set the two complex numbers, Z and C to the origin (0, 0).

Now we iterate from the top left to bottom right corners of our screen, using the centre of the screen as the coordinates (0,0). When we draw the points physically, we will add the offset to draw on the right location, since (0,0) is the top left corner in most images, but for the calculations , the top left corner will be (-width / 2, -height / 2).

So for each iteration, we adjust the real and imaginary portions of Z using the scaling and offset values, and then set C to Z.

Now, we iterate up to the iteration depth we specified. Each time we iterate, we apply the formula Z = Z^(Power 1) + Z^(Power 2) + C. For a normal Mandelbrot, these values are set to 2 and 0, so for the standard Mandelbrot, this equation becomes Z = Z^2 + C. You are encouraged to experiment with other values to get some really interesting looking images.

If the absolute value of Z is greater than 2, we then stop iterating, and take note of which iteration number we stopped at. This will be used to determine what colour we are going to plot at that point.

So, now we are ready to plot our point, and using the DrawComplexPoint function we plot the point. At this point, we add the offsets needed, as mentioned above, to move our coordinate system to the correct places for our image.

What this function also does is selects the colour to draw. In our code, there are 16 predefined colours in an array, which is selected based on the modulus of the iteration number we found in the previous step.

The full source code for can be found here.

   		Color[] oColor = new Color[16];
		oColor[0] = Color.Black;
		oColor[1] = Color.Blue;
		oColor[2] = Color.Brown;
		oColor[3] = Color.Green;
		oColor[4] = Color.Magenta;
		oColor[5] = Color.Orange;
		oColor[6] = Color.Red;
		oColor[7] = Color.DarkGray;
		oColor[8] = Color.LightBlue;
		oColor[9] = Color.LightGreen;
		oColor[10] = Color.LightYellow;
		oColor[11] = Color.PaleVioletRed;
		oColor[12] = Color.Ivory;
		oColor[13] = Color.Yellow;
		oColor[14] = Color.Cyan;
		oColor[15] = Color.Lime;

		public void Generate(Graphics g, int iIterations, double Scaling, int iInitialSize, double iOffsetRe, double iOffsetIm, int iLeft, int iTop, int iWidth, int iHeight, int iPower, int iPower2)
		{
			Complex Z = new Complex( 0.0, -0.0);
			Complex C = new Complex( 0.0, -0.0);
			Complex Offset = new Complex( 0.0, -0.0);

			for (double i = -iWidth/2; i < iWidth/2 ; i++)
			{
				for (double j = -iHeight/2; j < iHeight/2; j++)
				{
					// Normalize Z and adjust for Scaling and Offset
					Z.re = (i/((double)iInitialSize)) * Scaling + (double)iOffsetRe;
					Z.im = (j/((double)iInitialSize)) * Scaling + (double)iOffsetIm;

					// C is the Z(0) of the formula based on the pixel position
					C.re = Z.re;
					C.im = Z.im;

					int iteration = 0;

					// break out if or when |Z| > 2
					for (int k = 1; k < iIterations; k++)
					{
						Z = (Z^iPower) + (Z^iPower2) + C;
						// if modulus of Z > 2, break out of the loop
						// and remember the current iteration to choose the color
						if (Z.Abs() > 2.0)
						{
							iteration = k;
							break;
						}
					}

					// draw the point on the complex plain and choose the color based on the iteration
					// the color is picked by casting the iteration to a KnownColor enumeration
					DrawComplexPoint(g, ((int)i) + (iWidth/2), ((int)j) + (iHeight/2), iteration);
				}
			}
		}

		private void DrawComplexPoint(Graphics g, int iX, int iY, int iColor)
		{
			g.FillRectangle(new SolidBrush(oColor[iColor%16]), iX, iY, 1, 1);
		}
Share

A T-Square fractal is a relatively simple affair.

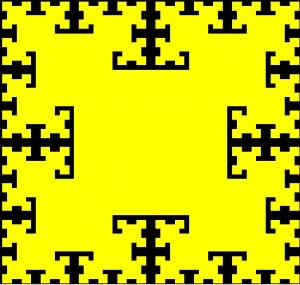
T-Square

T-Square


The procedure to create a T-Square starts off with a square canvas on which we are going to draw. It will work with rectangular canvases as well, but then the results will look slightly different.

When we call the Generate function, we need to pass to it the coordinates of the first square, which, to get the best fit into our canvas, we calculate the lengths of the sides of the square to be half the canvas sides, and then centre the square, essentially making the top left corner a quarter of the way to the right and down of the origin.

The first thing we do is draw a solid square using our coordinates.

Now, until we reach our desired recursion depth, we generate four new squares, which have half the width and height, and make the centres of each of these squares to be centred on each of the four corners of the original square.

This process is then repeated until we have recursed far enough.

You can download the full source code here.

        public void GenerateTSquare(Graphics g, int iIterations, double iLeft, double iTop, double iWidth, double iHeight, Color oColor)
        {
            g.FillRectangle(new SolidBrush(oColor), (float)iLeft, (float)iTop, (float)iWidth, (float)iHeight);
            if (iIterations > 1)
            {
                double dNewWidth = iWidth / 2.0;
                double dNewHeight = iHeight / 2.0;

                GenerateTSquare(g, iIterations - 1, iLeft - (dNewWidth / 2.0), iTop - (dNewHeight / 2.0), dNewWidth, dNewHeight, oColor);
                GenerateTSquare(g, iIterations - 1, iLeft + iWidth - (dNewWidth / 2.0), iTop - (dNewHeight / 2.0), dNewWidth, dNewHeight, oColor);
                GenerateTSquare(g, iIterations - 1, iLeft - (dNewWidth / 2.0), iTop + iHeight - (dNewHeight / 2.0), dNewWidth, dNewHeight, oColor);
                GenerateTSquare(g, iIterations - 1, iLeft + iWidth - (dNewWidth / 2.0), iTop + iHeight - (dNewHeight / 2.0), dNewWidth, dNewHeight, oColor);
                

            }
        }

Share

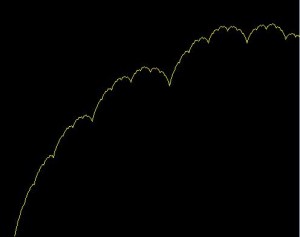
Brownian motion is described by an essentially random motion, which, one of the most famous examples is the movement of a speck of dust floating on the surface of a glass of water.

Brownian Motion

Brownian Motion

For our fractal, the random element of the brownian motion, while essentially still being random is constrained by the end points. To create the fractal, we start with an array of 128 double values. This array could in theory be any size, and is not a fixed requirement.

Now, the first element and last element are our starting and ending points of our path. In the code, these points are randomly generated, but could just as easily be set explicitly.

Before we look at the Generate function, I am going to look at the Gauss function. This function takes three parameters – the seed for the random number generator (so we can create the same fractal by passing the same seed), Mu and Sigma.

The Mu value is the base displacement we want the path to move, and the Sigma value is a multiplier for the random element.

A random number is generated, which is then multiplied by Sigma, which is then added to Mu to give us the displacement of the value for that step in the calculation.

        private double Gauss(int iSeed, double fMu, double fSigma)
        {
            double fx;
            int i;

            fx = 0;
            for (i = 0; i < 12; i++)
            {
                fx = fx + (new System.Random(iSeed).NextDouble());
            }
            fx = fx - 6.0;
            return fMu + fSigma * fx;
        }

continue reading...

Share